Platformun Temel Özellikleri
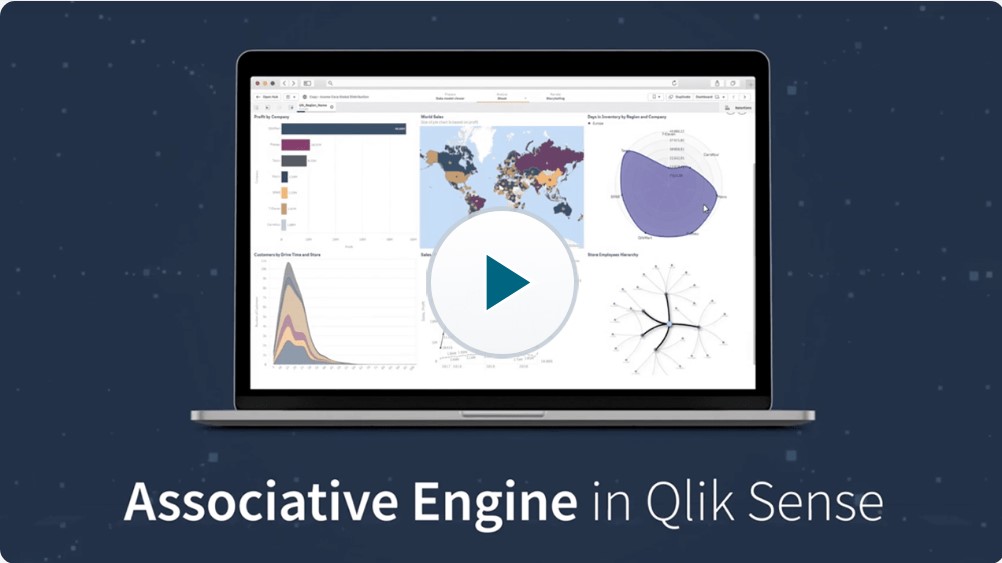
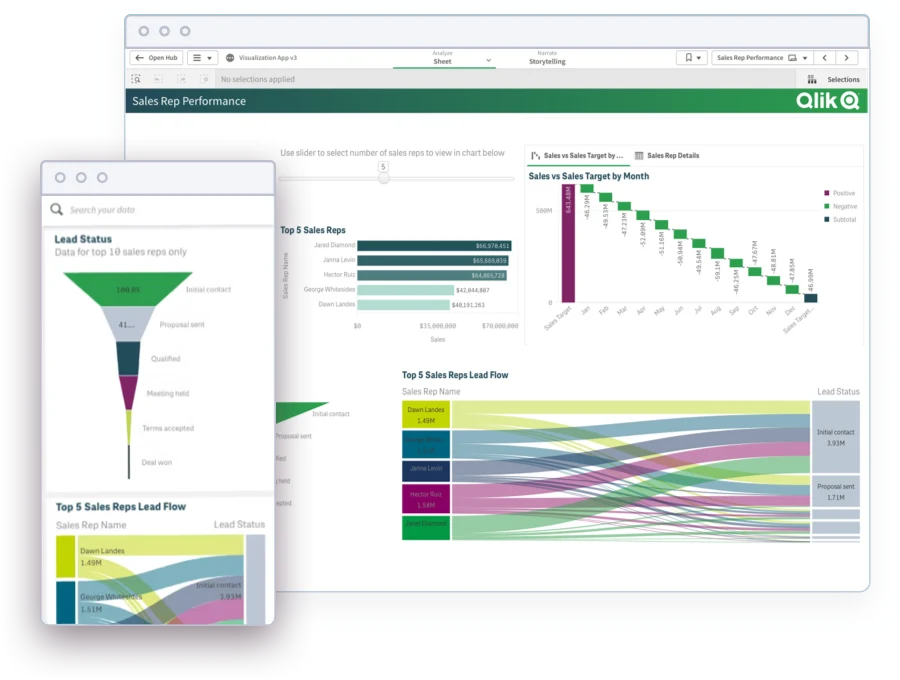
Highly interactive. Always in context. Lightning fast. No one else compares.
Qlik’s one-of-a-kind associative analytics engine brings unmatched power to explore your data and uncover insights.
Make selections freely in all objects, in any direction, to refine context and make discoveries. Get instant calculations at the speed of thought, at scale. Yeah, it’s a big deal. And it’s why Qlik Sense takes you way beyond the limits of query-based analytics and dashboards our competitors offer.
Drive deeper insight with augmented analytics
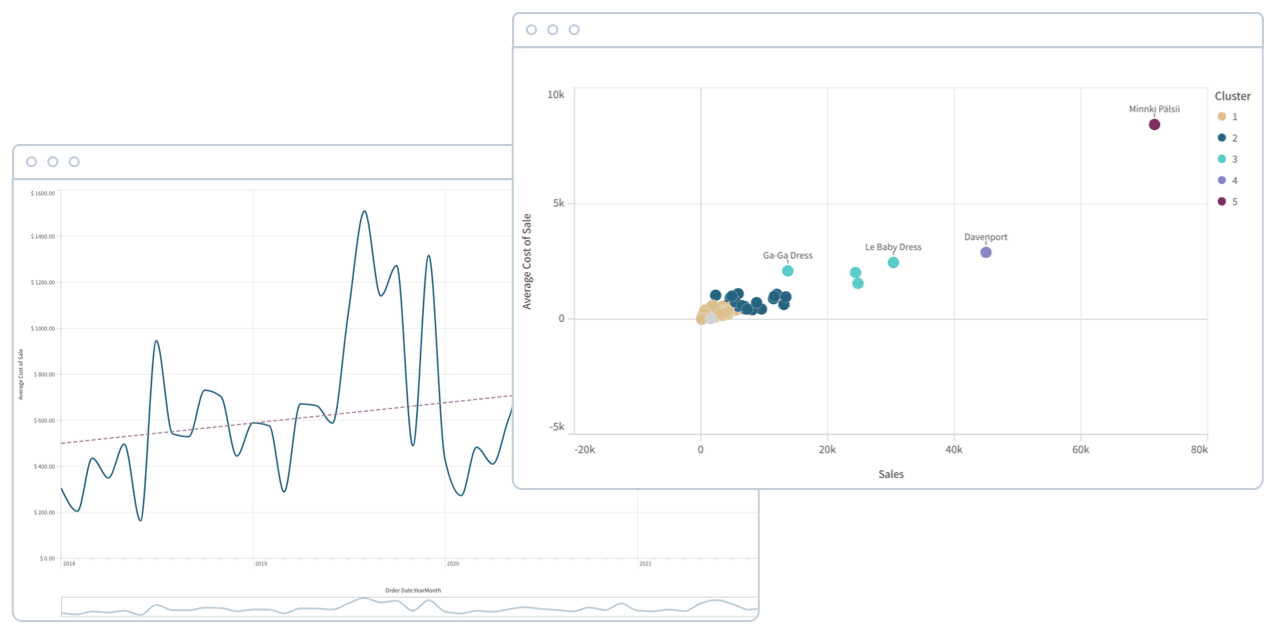
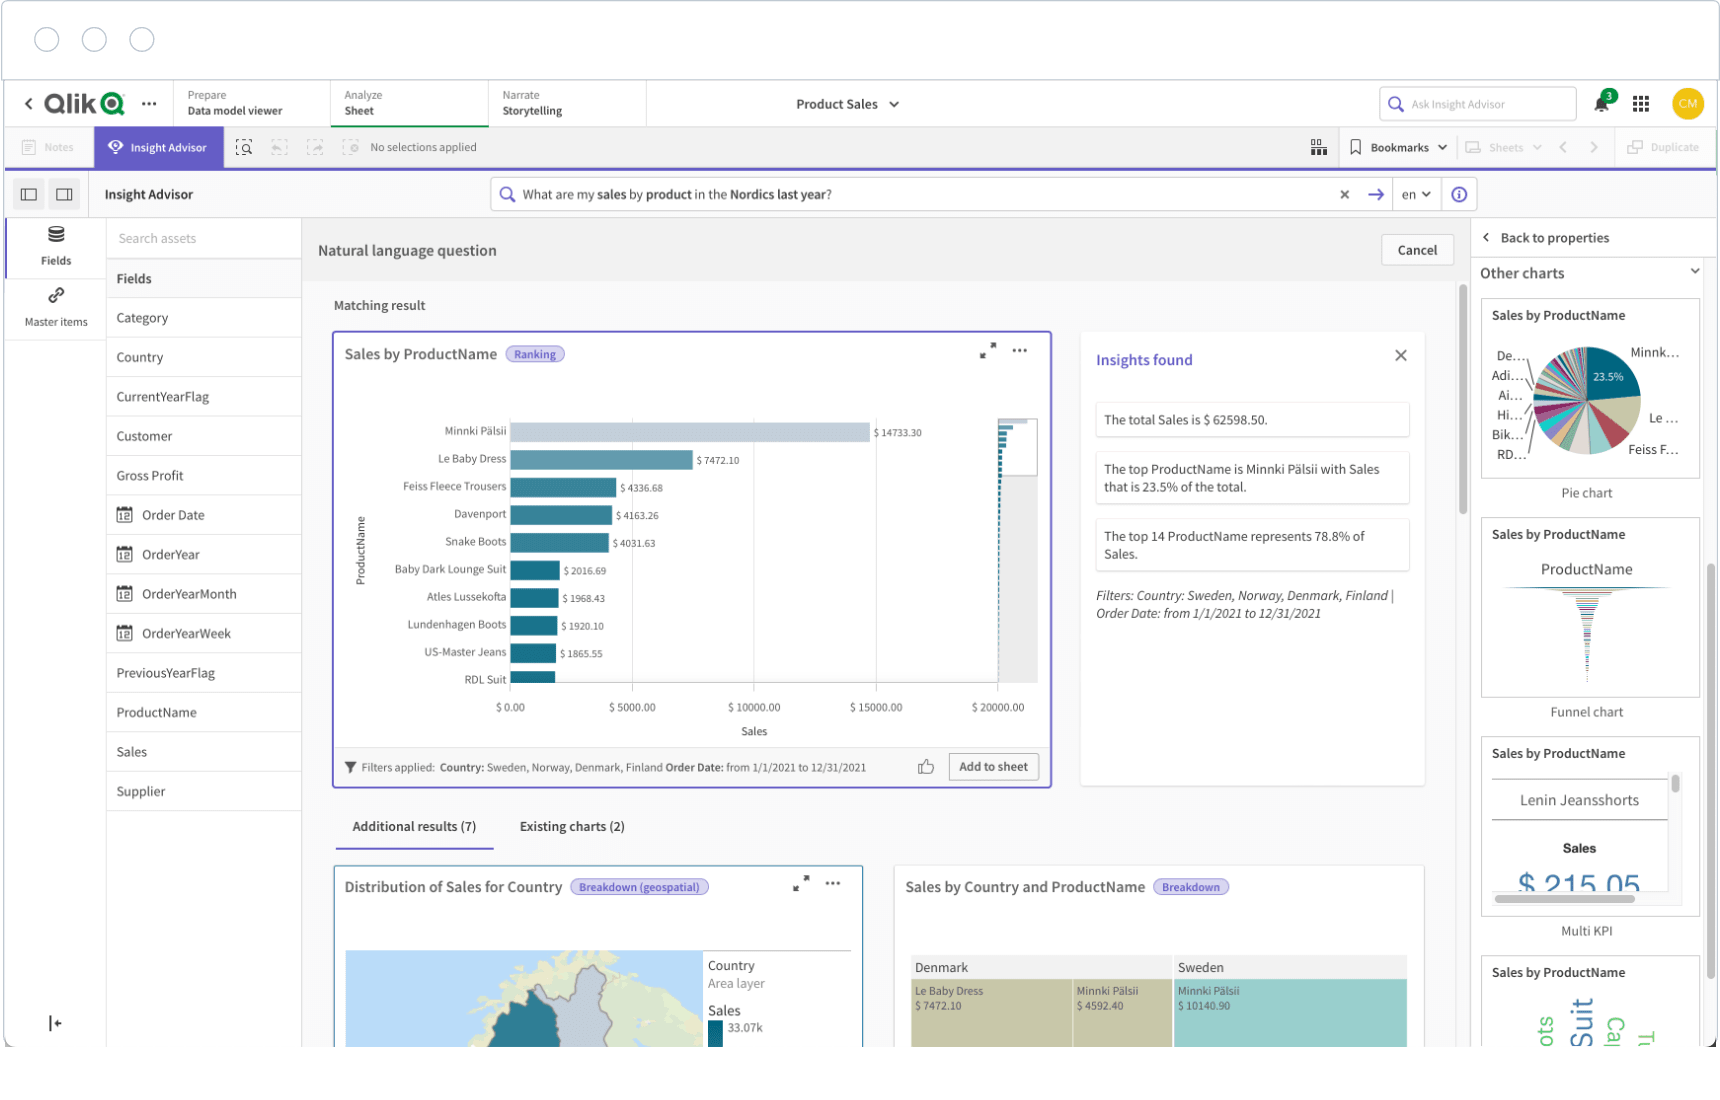
With AI and ML built into our foundation, we deliver a full range of uniquely integrated augmented analytics capabilities that allow more people, regardless of skill level, to reach their full potential with data. Take advantage of:
- Automated insight generation
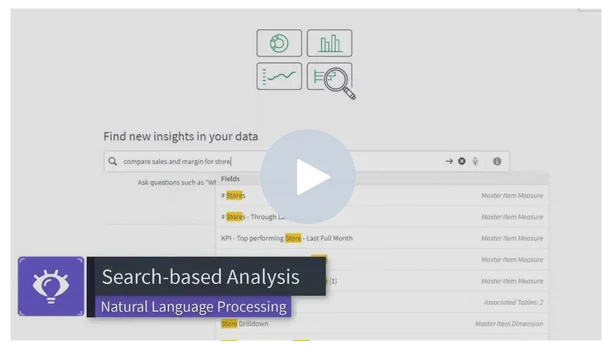
- Search and natural language interaction
- AI-assisted creation and data prep
- AutoML & predictive analytics
Take Intelligent Action in the Moment
Organizations need a dynamic relationship with information that reflects the current moment. We combine a real-time data pipeline with action-oriented capabilities that provide in-the-moment insights and drive immediate action.
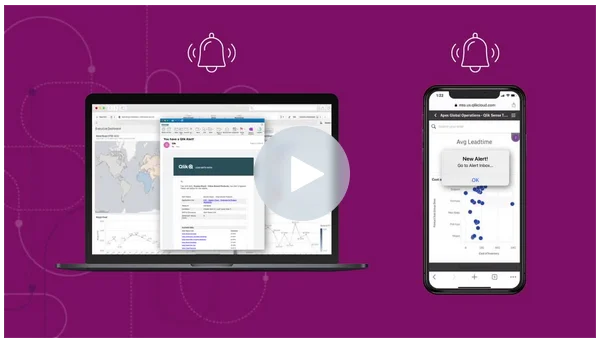
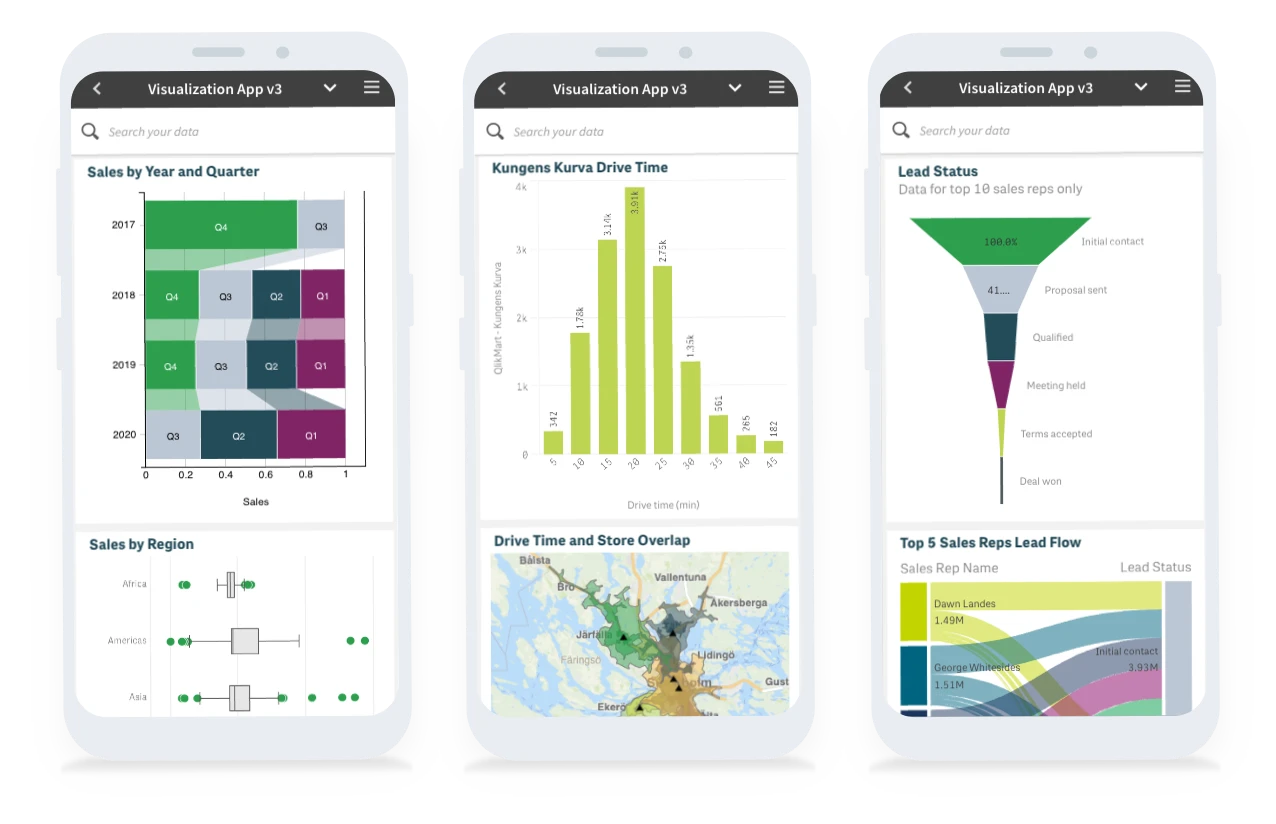
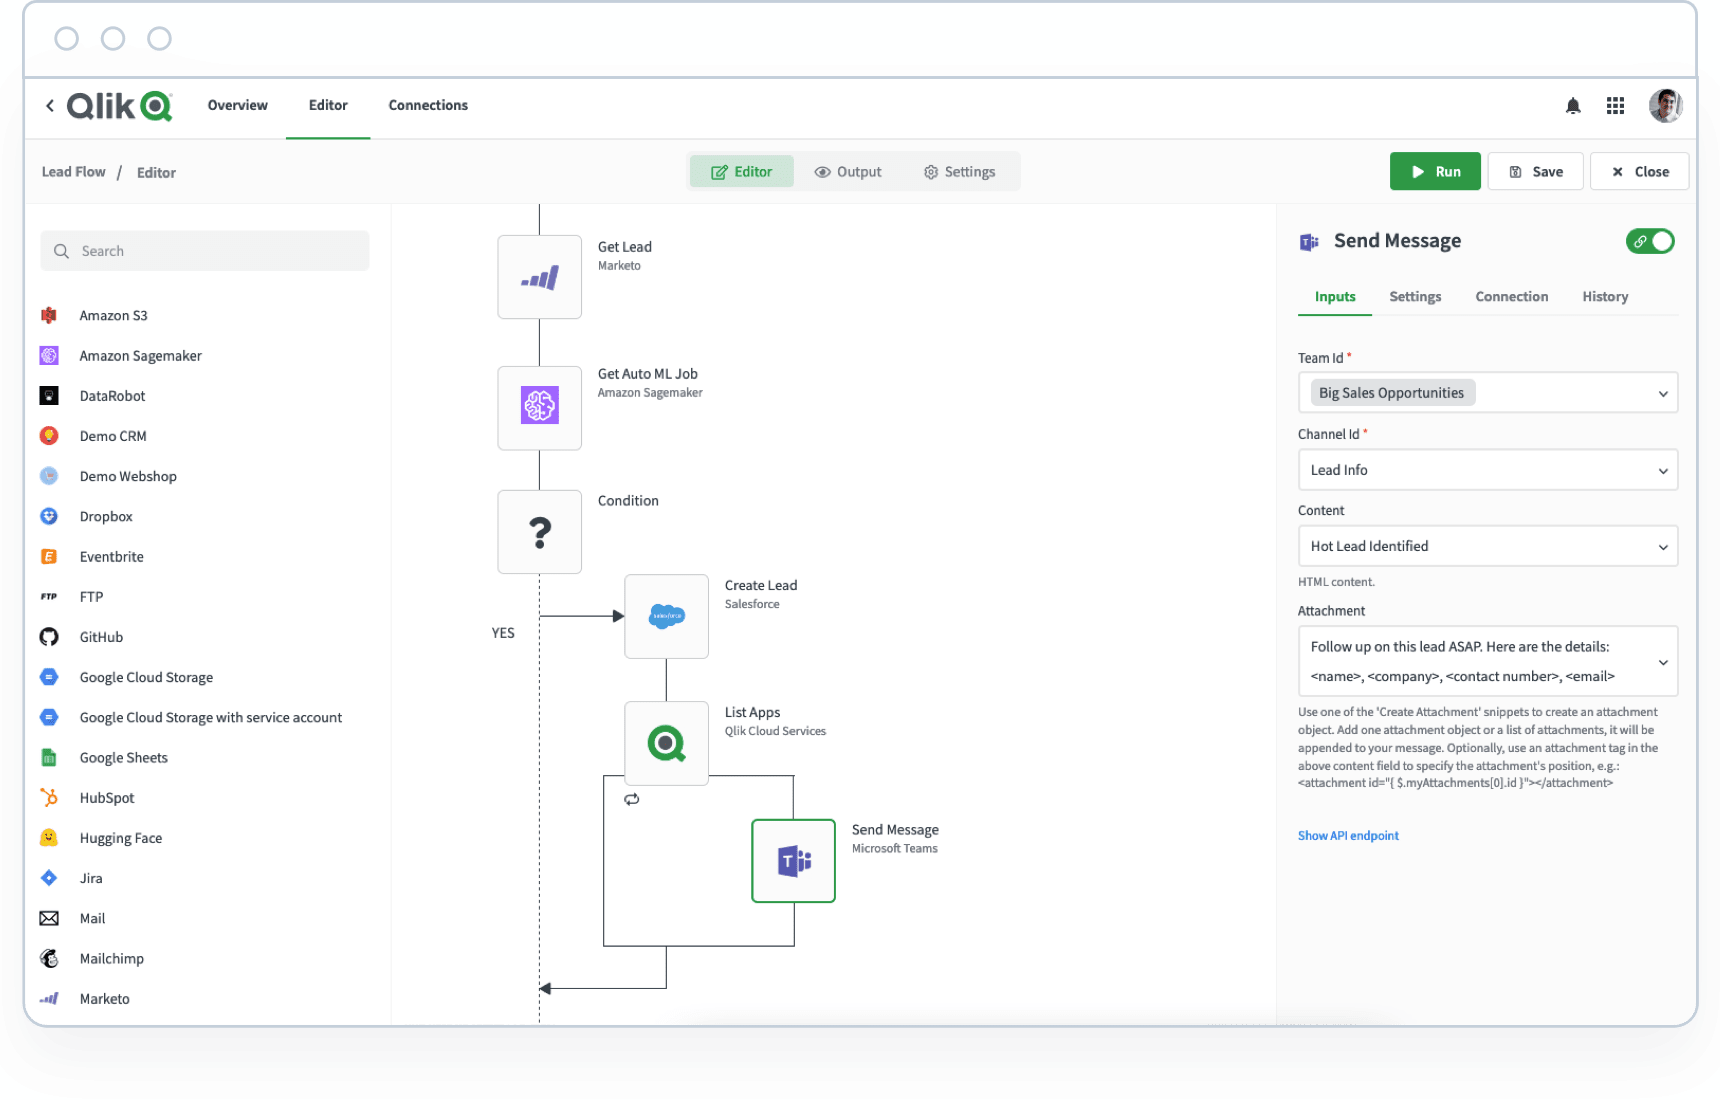
Seize every business moment with intelligent alerting, powerful collaboration, mobile and embedded analytics, and automated triggering of immediate actions.

Get Started with Qlik Sense
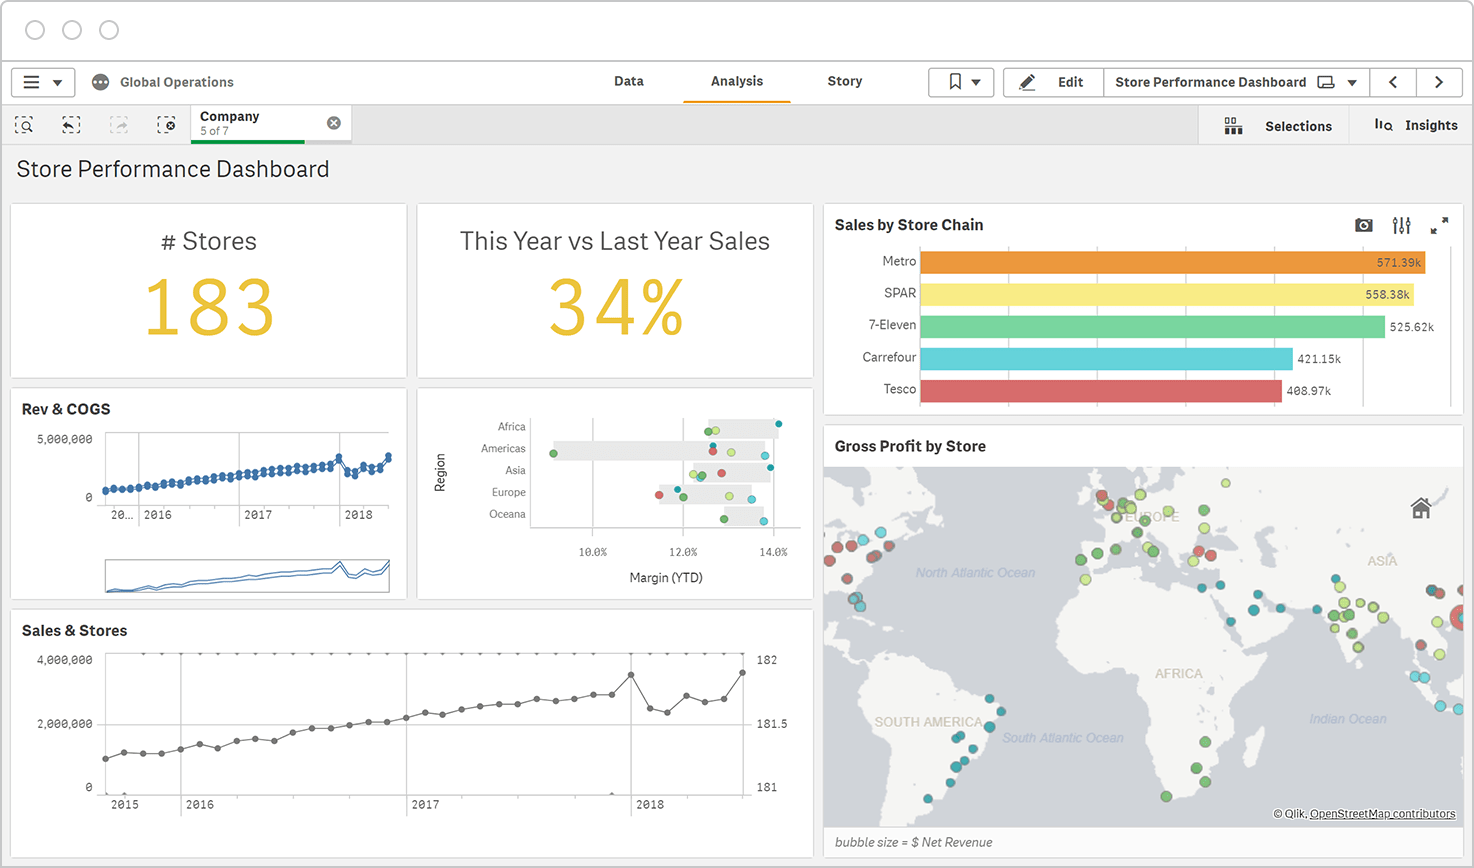
See why more than 40,000 customers trust Qlik. Easily explore information and quickly gain insights.
- Connect and combine data from hundreds of data sources
- Best-in-class visualization and discovery at your fingertips
- Get AI-generated insight suggestions, automatically
Data Prep & Connectivity
Qlik Sense provides a complete set of data preparation and integration capabilities, allowing users to work with nearly limitless combinations of data, both big and small.
Data Catalog
A well-governed, self-service catalog of all analytics-ready data makes it easy to find the right data and know its origin and journey. Use all your data with confidence because you can easily find it and trust it.
Application Automation
Build automation workflows and trigger event-driven actions in Qlik Sense and other cloud applications through a visual, low-code environment. A broad library of connectors are available to cloud applications.
Collaboration & Notes
Add narrative and context to analytics, and create discussion threads to interact with others actively around data. Support team decisioning with the critical business context needed for the best outcomes.
Sıkça Sorulan Sorular
Qlik Cloud Analytics ve Qlik Sense arasındaki fark nedir?
Qlik Cloud Analytics, Qlik analitik çözümlerinin tüm gücünü bulut tabanlı bir SaaS dağıtımında sunar. Qlik Sense, yüksek düzeyde düzenlemeye tabi sektörler ve müşteri tarafından yönetilen bir teklifi tercih eden müşteriler için şirket içi çözümümüzdür.
Qlik Sense hangi veri kaynakları ile entegre olur?
Qlik, uygulamalar ve veritabanlarından bulut hizmetlerine, dosyalara ve daha fazlasına kadar yüzlerce veri kaynağından gelen verileri bağlamayı ve birleştirmeyi kolaylaştırır. Qlik Sense için yaygın veri kaynaklarını ve bağlantı seçeneklerini keşfedin.
Qlik Sense Yapay Zeka (AI) özelliklerine sahip mi?
Evet, Qlik Sense, benzersiz ilişkisel motorumuzla birlikte temel düzeyde yerleşik yapay zeka teknolojisine sahiptir.Insight Advisor analizler ve içgörüler önerir, analitik oluşturma ve veri hazırlama süreçlerini otomatikleştirir ve arama tabanlı ve diyalogsal analitik için doğal dil etkileşimini destekler.Qlik AutoML, doğrudan analitik kullanıcıları ve ekipleri için güçlü anahtar sürücü analizi, tahmine dayalı analitik ve what-if senaryoları sağlar. Gelişmiş analitik entegrasyonu sayesinde, veri bilimi platformlarından ve AutoML’den gelen tahmine dayalı hesaplamaları doğrudan Qlik Sense panolarına kolayca dahil edebilir ve gerçek zamanlı iş kullanıcısı keşfini destekleyebilirsiniz.
Qlik Sense ne kadara mal oluyor?
Qlik Sense müşteri tarafından yönetilen fiyatlandırma için lütfen bizimle iletişime geçin. Qlik Cloud Analytics fiyatlandırmasını fiyatlandırma sayfasında bulabilirsiniz.
Qlik Sense’i başka bir görsel analiz aracından daha fazlası yapan nedir?
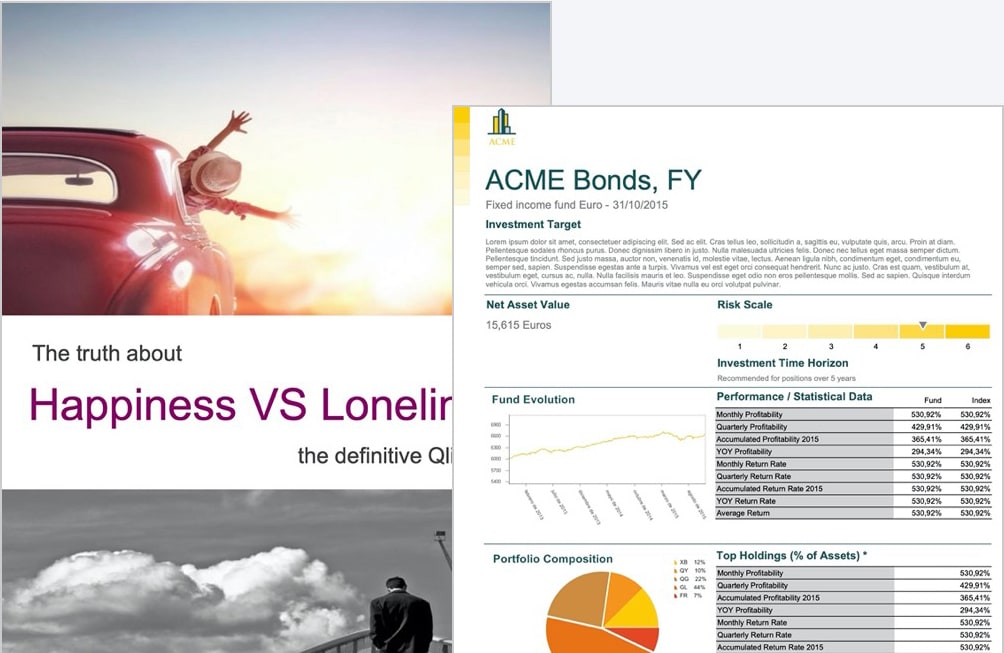
Yalnızca odaklanmış nokta çözümleri sunan birçok popüler veri analitiği aracının aksine Qlik Sense, sektördeki en eksiksiz veri analitiği yetenek setini sunar. Self servis görselleştirme ve ilişkisel keşiften gösterge tablolarına, gömülü analitiğe, raporlamaya, mobile, artırılmış analitiğe (AI) ve daha fazlasına kadar tüm analitik kullanım durumlarını destekler. Bulut tabanlı veri analitiği platformumuz yüksek performanslı ölçeklenebilirlik, esnek açık ve standart API’ler, güçlü veri entegrasyonu ve bağlanabilirliği, merkezi yönetim ve yönetişim ile tüm kurumların taleplerini karşılar.


