In today’s business landscape, data-driven approaches have become increasingly vital for strategic decision-making, employee performance monitoring, and organizational health assessment in human resources management. An HR Dashboard serves as a powerful tool that transforms this complex data ecosystem into meaningful, actionable insights. Modern HR departments are no longer positioned merely as operational support units but as value centers that directly contribute to an organization’s strategic objectives.
In this content, we’ll provide a comprehensive definition of HR Dashboards, examine their types and applications, address the fundamental principles of effective dashboard design, and discuss how emerging technological trends are transforming HR Dashboards. We’ll offer in-depth information and practical recommendations to help HR departments maximize the benefits of data analytics.
Definition and Key Features of HR Dashboards
An HR Dashboard is a data visualization tool that presents data collected and processed by the human resources department in a visual format, enhancing organizations’ abilities to understand, monitor, and optimize workforce dynamics. Its primary purpose is to transform complex HR data into understandable and actionable insights.
Key features of HR Dashboards include:
Data Consolidation: Combines data from different systems and sources onto a single platform. This brings together various data points such as personnel information systems, performance evaluation data, and employee satisfaction surveys to provide a holistic view.
Real-Time Monitoring: Modern HR Dashboards process data in real-time or near real-time, allowing HR professionals and managers to see the current situation instantly.
Interactive Visualization: Users can filter different data dimensions, drill down into details, and create customized views. This interactive structure facilitates focusing on specific issues or opportunities.
Automated Reporting: Instead of manually preparing regular reports, automated reports can be generated according to predefined metrics and periodically delivered to relevant stakeholders.
The primary benefits that HR Dashboards provide to HR departments include:
Data-Driven Decision Making: Enables strategic decisions based on comprehensive and current data, rather than decisions based on intuition or limited information.
Time Savings: Automates manual data collection and reporting processes, allowing HR professionals to focus on more strategic tasks.
Proactive Problem Solving: Detects potential problems at an early stage, enabling intervention with a proactive rather than reactive approach.
Strategic HR Management: Supports the transformation of the HR function from an operational support unit to a value center that directly contributes to business strategy.
Types of HR Dashboards and Their Applications
HR Dashboards can be categorized according to their usage purposes and target users.
Strategic HR Dashboards
Strategic HR Dashboards cater to senior executives and HR leaders, focusing on data that supports the organization’s long-term human resources strategy. These dashboards typically include metrics such as employee turnover trends, talent pool capacity, workforce costs, and ROI assessment of HR initiatives.
Strategic dashboards generally focus on trends over longer time periods and include metrics directly related to business objectives.
Operational HR Dashboards
Operational HR Dashboards focus on monitoring and managing daily or weekly HR operations. Used by HR specialists and middle managers, these dashboards may include metrics such as time-to-fill open positions, recruitment process efficiency, training program completion rates, and current absenteeism data.
Tactical HR Dashboards
Tactical HR Dashboards focus on medium-term goals and projects. These dashboards are used by department managers and HR business partners and typically include metrics evaluated on a quarterly or semi-annual basis. They track indicators such as department-based performance metrics, employee satisfaction scores, and progress of talent development programs.
Dashboard Varieties Specific to Different HR Sub-units
Different sub-units of the human resources function can use dashboards customized for their focus areas:
- Recruitment Dashboards: Track metrics such as candidate pool metrics, sourcing efficiency, and recruitment costs.
- Employee Development Dashboards: Monitor the effectiveness of training programs, skill development tracking, and career progression metrics.
- Employee Relations Dashboards: Include employee satisfaction, complaint management, and organizational health indicators.
- Compensation and Benefits Dashboards: Track pay equity analysis, market comparisons, and benefits utilization analysis.
Best Practices in HR Dashboard Design
The effectiveness of an HR Dashboard depends on its design and user experience as well as the metrics it contains.
Data Visualization Principles and Techniques
Effective data visualization makes complex data understandable:
- Choosing the Right Chart Type: Use the most appropriate visualization type for each metric. For example, line charts for trends over time, column charts for comparisons.
- Color Coding and Consistency: Use colors meaningfully and consistently. For example, green can be used to indicate positive performance, red for areas requiring attention.
- Optimizing Data-Ink Ratio: Minimize unnecessary visual elements to ensure focus on the data. Prefer a simple design instead of fancy backgrounds and excessive colors.
- Providing Comparative Context: Present metrics with comparative context. For example, compare current month’s data with the previous month or year.
User Experience-Focused Design Approaches
User experience is critical for dashboard adoption:
- Target User Analysis: Before designing the dashboard, analyze the needs of the target users. Senior executives generally prefer summary views, while HR specialists may need more detailed analysis capabilities.
- Interactive Filtering Features: Allow users to filter data by different dimensions such as department, location, and time frame.
- Intuitive Navigation: Create a logical structure that facilitates navigation within the dashboard. Group related metrics and ensure users can quickly access the information they need.
- Help and Explanation Elements: Add help buttons or tooltips that provide explanatory information about metrics and visualizations.
Effective KPI Selection and Presentation
Key Performance Indicators form the focal point of the dashboard:
- Establishing SMART KPIs: Define Specific, Measurable, Achievable, Relevant, and Time-bound KPIs.
- Using a Limited Number of KPIs: Focus on 5-7 main KPIs in a dashboard to avoid information overload.
- Target vs. Actual Comparison: Clearly show target values and actual status for each KPI.
- Adding Trend Information: Include mini trend charts that show the change of KPIs over time, in addition to their current status.
Mobile-Compatible Dashboard Design
Access to dashboards anywhere is becoming increasingly important in the modern work environment:
- Responsive Design: Ensure the dashboard is designed to adapt to different screen sizes.
- Mobile-Priority Metrics: Highlight the most critical metrics for mobile view.
- Simplified Navigation: Simplify menus and filtering options to facilitate navigation on mobile devices.
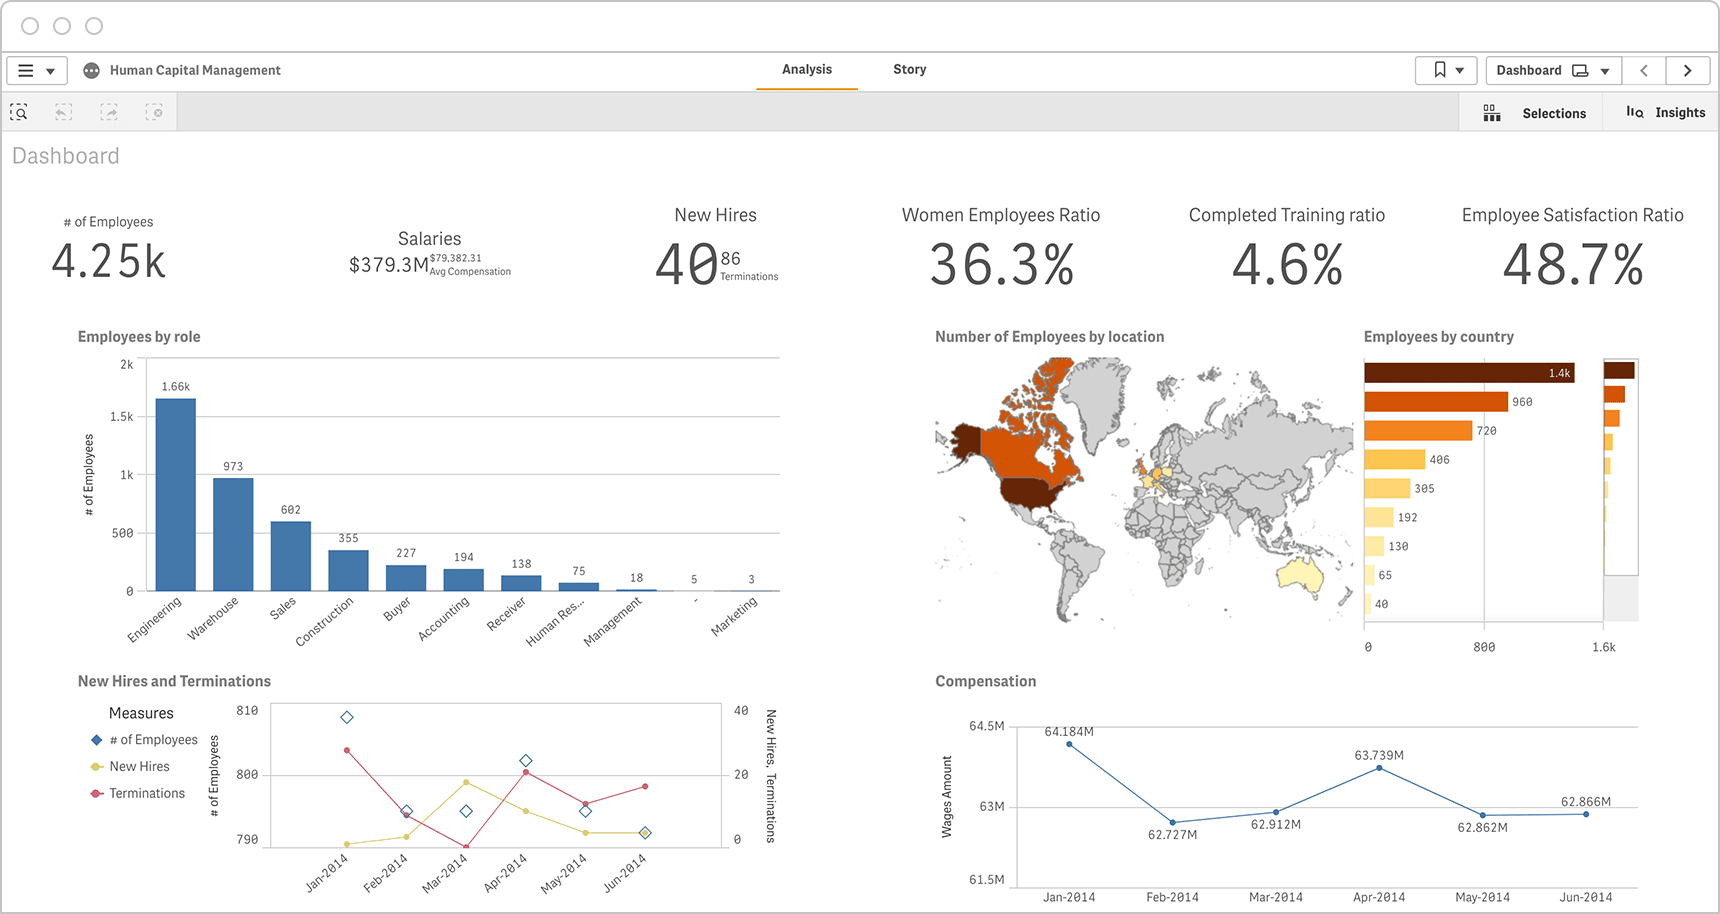
As seen in Qlik’s HR dashboard examples, modern dashboard solutions provide interactive, adaptable, and user-friendly interfaces that support HR departments in making data-driven decisions.
HR Dashboard Technologies and Current Trends
Technologies and trends in human resources analytics are rapidly evolving.
Modern HR Dashboard Features
Today’s advanced HR dashboard solutions offer various advanced features:
- Self-Service Analytics: Tools that allow HR professionals to create their own analyses and customize their dashboards without requiring technical expertise. Qlik’s drag-and-drop interfaces enable non-technical users to benefit from data analytics.
- Storytelling Features: Tools that transform data into a meaningful narrative. For example, interactive presentations that explain the results of a recruitment campaign step by step.
- Natural Language Querying: Tools that allow users to perform data analysis by asking questions in everyday conversational language.
- Multiple Data Source Integration: Platforms that combine different data sources such as HRIS, ATS, and performance management.
Integration of Artificial Intelligence and Machine Learning
Artificial intelligence and machine learning are making HR dashboards smarter:
- Predictive Turnover Analytics: Models that predict the likelihood of employees leaving can detect high-risk employees at an early stage.
- Sentiment Analysis: Tools that analyze textual data collected from employee surveys and feedback to evaluate the organizational climate.
- Talent Matching Algorithms: Systems that automatically match job requirements with employee profiles.
Real-Time Data Analysis Trends
Real-time data analysis enables proactive HR management:
- Instant Alert Systems: Systems that send automatic alerts to relevant stakeholders when there are sudden changes in critical metrics.
- Continuous Performance Monitoring: Continuous feedback and performance monitoring tools instead of annual evaluations.
- Employee Experience Pulse Check: Mini surveys and sentiment analysis tools that measure the employee experience at regular intervals.
Predictive Analytics and Scenario Planning Capabilities
Predictive analytics is becoming increasingly important for forward planning:
- “What-If” Analysis: Tools that model the potential impacts of different scenarios. For example, analyses that answer questions like “What would be the recruitment need if the production department grows by 15%?”
- Long-Term Workforce Planning: Models that predict long-term workforce needs based on demographic trends, retirement projections, and growth plans.
- Talent Pool Risk Analysis: Systems that assess talent pool risks for critical positions and competencies.

Challenges in HR Dashboard Implementation and Solution Recommendations
There are several challenges that need to be overcome to achieve success in HR Dashboard implementations.
Data Quality and Integration Issues
Data quality directly affects the effectiveness of dashboards:
- Challenge: Inconsistency of data from multiple systems, missing data, and data entry errors.
- Solution Recommendations:
- Standardize data entry processes
- Implement automatic data validation controls
- Use data integration tools to ensure consistency between sources
- Create regular data cleaning and maintenance routines
User Adoption and Digital Competency Requirements
Dashboard adoption depends on users’ competencies:
- Challenge: Lack of digital literacy required for dashboard use and resistance to change.
- Solution Recommendations:
- Design user-friendly interfaces
- Develop training programs specific to the target audience
- Create step-by-step guides for dashboard use
- Demonstrate the value provided by dashboards with concrete examples
Data Privacy and Security Concerns
Protecting sensitive HR data is critically important:
- Challenge: Security of sensitive employee data and compliance with data protection regulations.
- Solution Recommendations:
- Implement role-based access controls
- Anonymize or aggregate personal data
- Conduct regular security audits
- Ensure compliance with data protection regulations (GDPR, etc.)
Challenges in Measuring Return on Investment
Proving the value of HR Dashboard investments can be difficult:
- Challenge: Difficulty in concretely demonstrating the ROI of dashboard investments.
- Solution Recommendations:
- Measure baseline performance metrics before and after dashboard implementation
- Quantify factors such as time savings, error reduction, and decision-making speed
- Document success stories and case studies
- Present examples showing the impact of dashboards on strategic decisions
The human resources function can strengthen its position as a strategic business partner by effectively using data analytics and visualization tools. HR Dashboards play a central role in this transformation, contributing to the development of a data-driven HR culture.
Before implementing HR Dashboards, businesses should clearly define their organizational needs, establish the appropriate technological infrastructure, and take the necessary steps to ensure user adoption. A properly designed and implemented HR Dashboard will open the doors to a more strategic, proactive, and data-driven approach in human resources management.
If you want to start the HR Dashboard journey for your organization or improve your existing dashboard applications, first determine your core metrics, prioritize user experience, and adopt a continuous improvement approach by following evolving technologies.