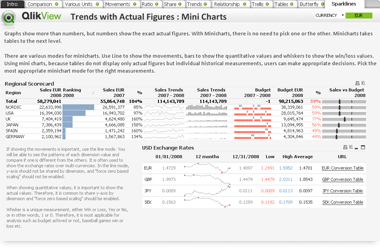

“When to use which chart?” is the first question you may ask yourself when building an application. Take a look in this file, and you will get an idea of how to show your data in the most effective way. Box plot, waterfall, trends, butterfly and more chart displays are introduced. Copy/paste objects from this application into yours and modify the settings to fit to your needs.